← Back to portfolio

TSUNAMI INVESTIGATION / FIELDWORK

Before the wave arrives.

At an exposed coast, a destructive tsunami is unlikely in any given year, but its impact can be enormous. A small yearly chance can add up over a human lifetime. Bridges, dams, and city centers must also be planned for decades of exposure to rare hazards.

This is one lesson in a planned series about four kinds of risk: frequent and minor, rare and minor, frequent and severe, or rare and severe. For a community in an ongoing war, serious disruption can be both likely and severe.

Read · Connect · Explain
How this lesson worksA quick guide to the website and BoodleBox

This website is your activity space. The BoodleBox guide is your conversation partner. Explore here, then bring your answers to the guide when you want to talk them through.

  1. Explore on this page.

    Follow the five stops below. Look at the images, try the choices, and write short answers in the boxes. Use the hints whenever you need them, then choose Continue at the bottom of each stop.

  2. Prepare your answers to share.

    At Harbor Point, choose Prepare note for BoodleBox whenever you want to discuss your current assumptions—even before you have an explanation. Review the note, then put it in a paired Chrome chat or copy and paste it. You can also share a checkpoint at stop 3 or your explanation at stop 5.

  3. Discuss, then come back.

    Review the note in your BoodleBox message box and press Send. Without the extension, paste it there first. The guide can explain a confusing idea or ask about your reasoning. Follow its next activity link when you are ready to continue here. Keep the same chat open for your next note.

You approve what the guide receives. The extension can place your chosen note in the chat draft; you review it and press Send. Copy and paste works too. Later clicks and answers stay on this website until you share another note. Your written answers are saved in this browser.

Open the BoodleBox guide ↗

For your first chat, open the guide above, sign in if needed, and choose Start New Chat. Keep that chat and this page open in separate tabs. If a long pasted note becomes attached text, type Discuss this checkpoint and send.

You can also finish the whole lesson here without BoodleBox, or discuss it with another AI assistant using the linked lesson guide. An agent can read the public guide; it sees your written answers only if you share them or ask it to operate this page in a browser. For a first try, keep Alaska · 1964 selected and begin with A distant coast.
Explore the full lesson, figures, and sources

The question worth asking

Why keep watch when most days are quiet?

Destructive tsunamis are rare, but a single event can kill thousands. NOAA estimates that tsunamis causing damage or deaths on distant shores occur about twice per decade worldwide. That is a historical average, not a schedule. NOAA/NWS background ↗

USGS earthquake monitoring and NOAA tsunami warnings work together to protect vulnerable coasts. Their value depends on being ready before the exceptional day arrives.

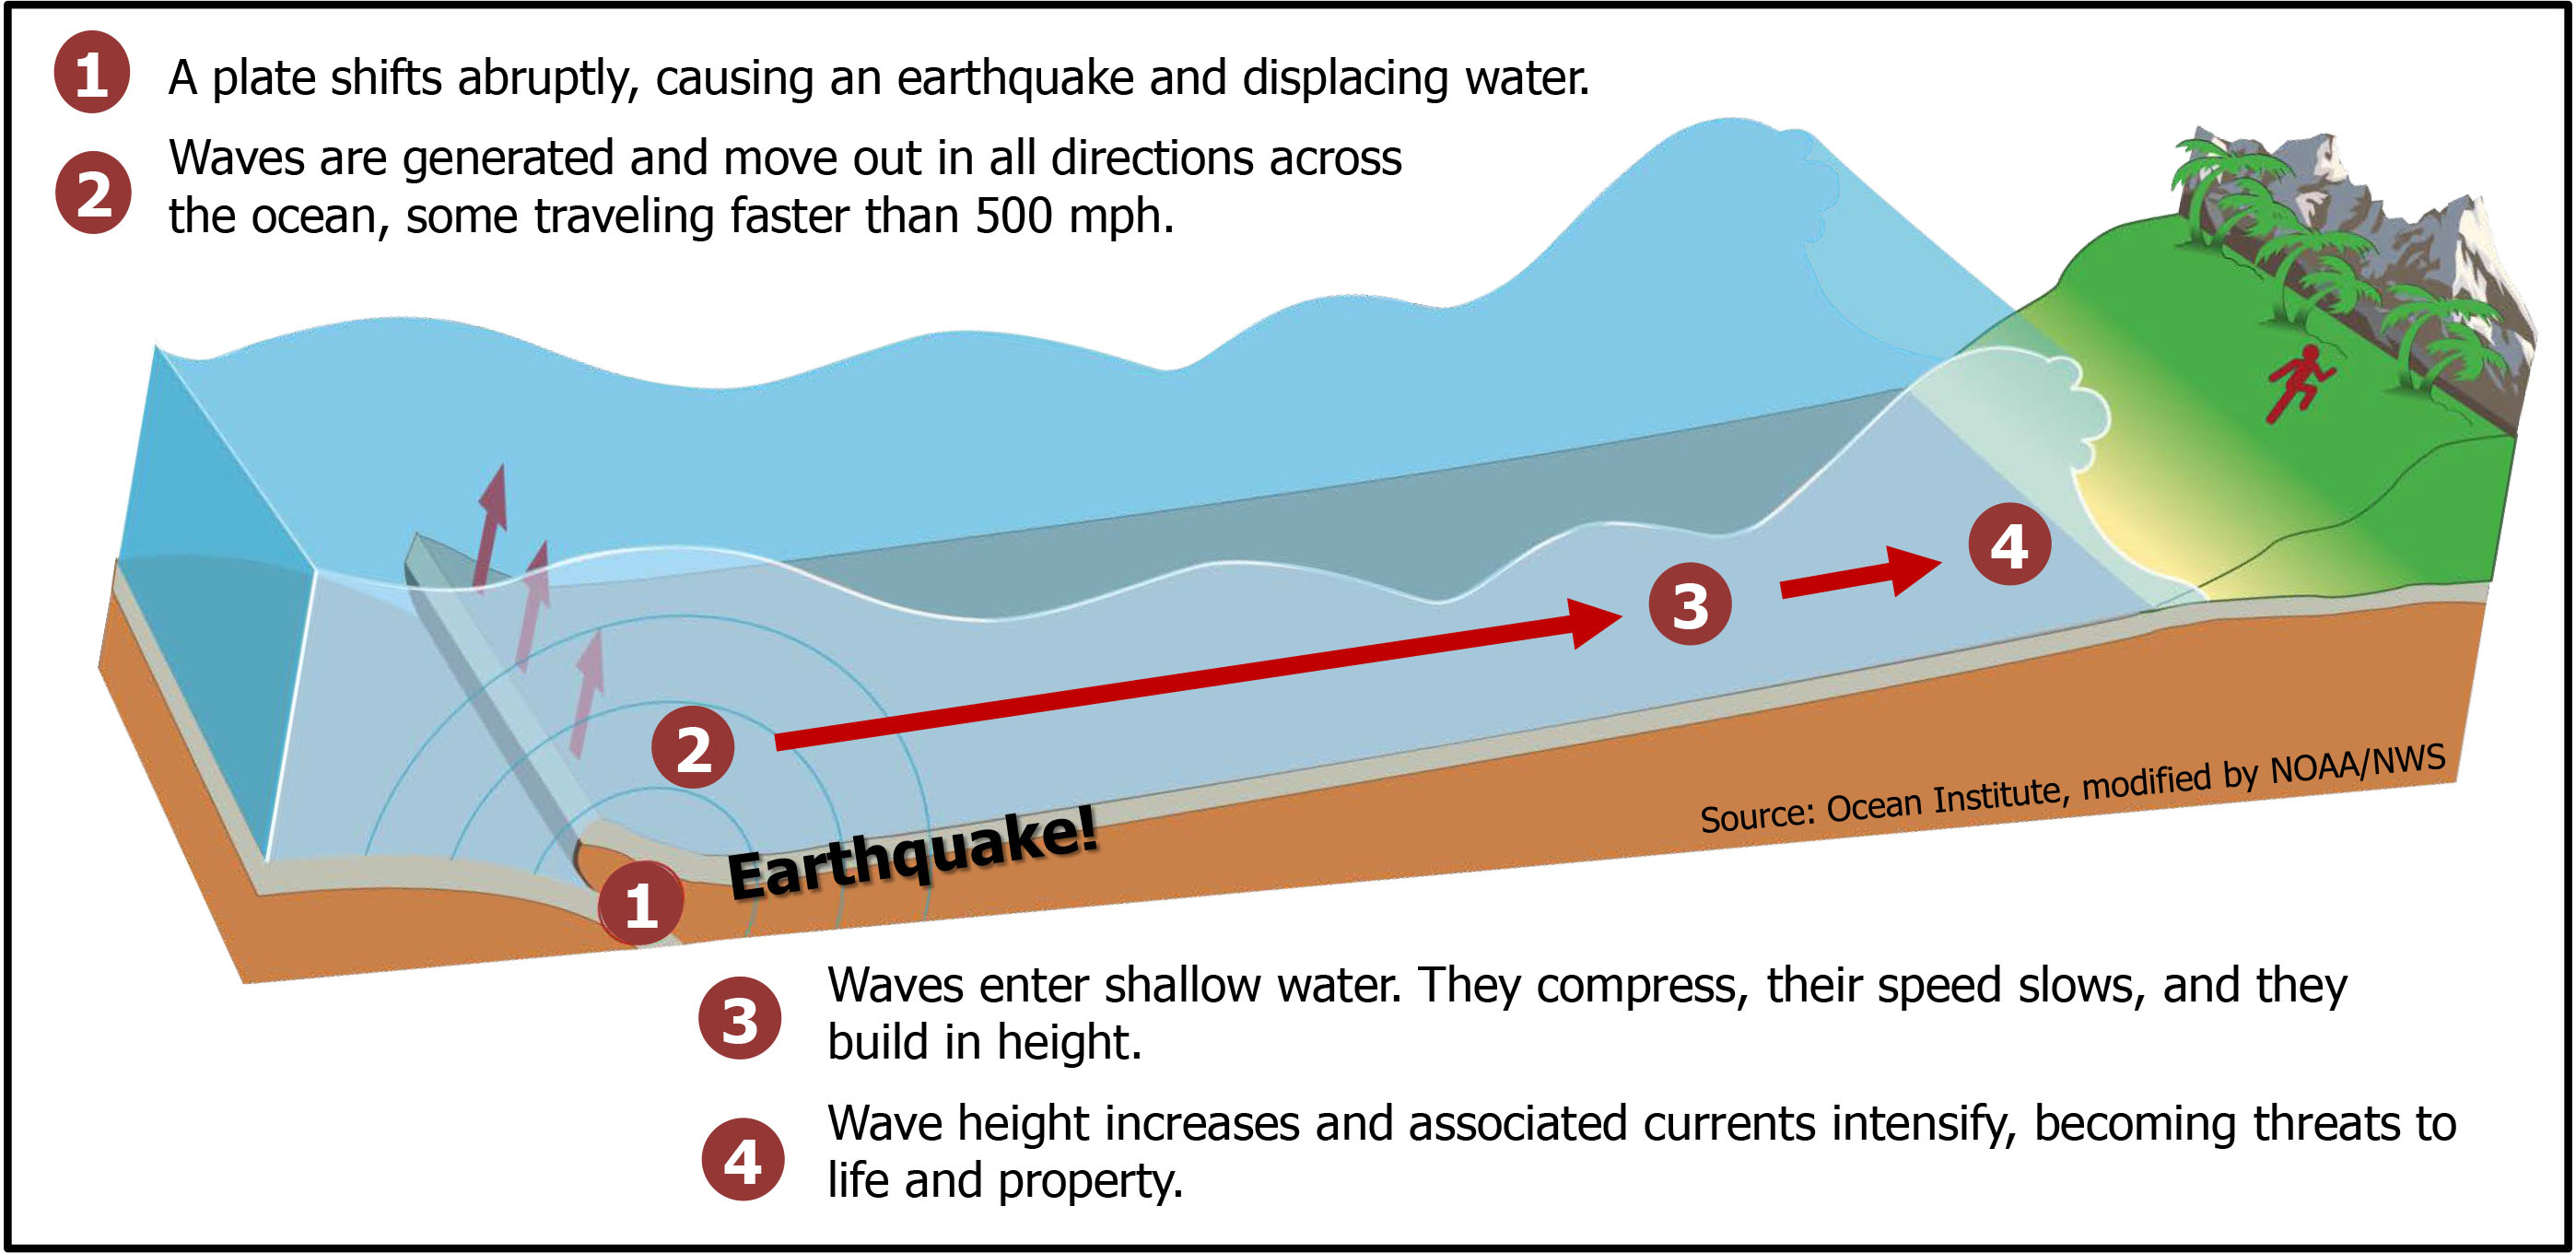
Figure 1 / How a tsunami develops

From a moving seafloor to a rising wave.

Four illustrated stages show an earthquake lifting the seafloor, water displaced above it, waves spreading across the ocean, and waves slowing and growing higher in shallow coastal water.
Figure 1. An underwater earthquake can displace water and send waves across an ocean. Not every earthquake causes a tsunami. Credit: Ocean Institute; modified by NOAA/NWS, as credited in the original image. NOAA/NWS source Open full-size image ↗

01 / What history shows

Three earthquakes. Consequences across oceans.

Read these examples of the damage tsunamis can cause and the difference warnings can make. The death estimates count different things; read the labels before comparing them.

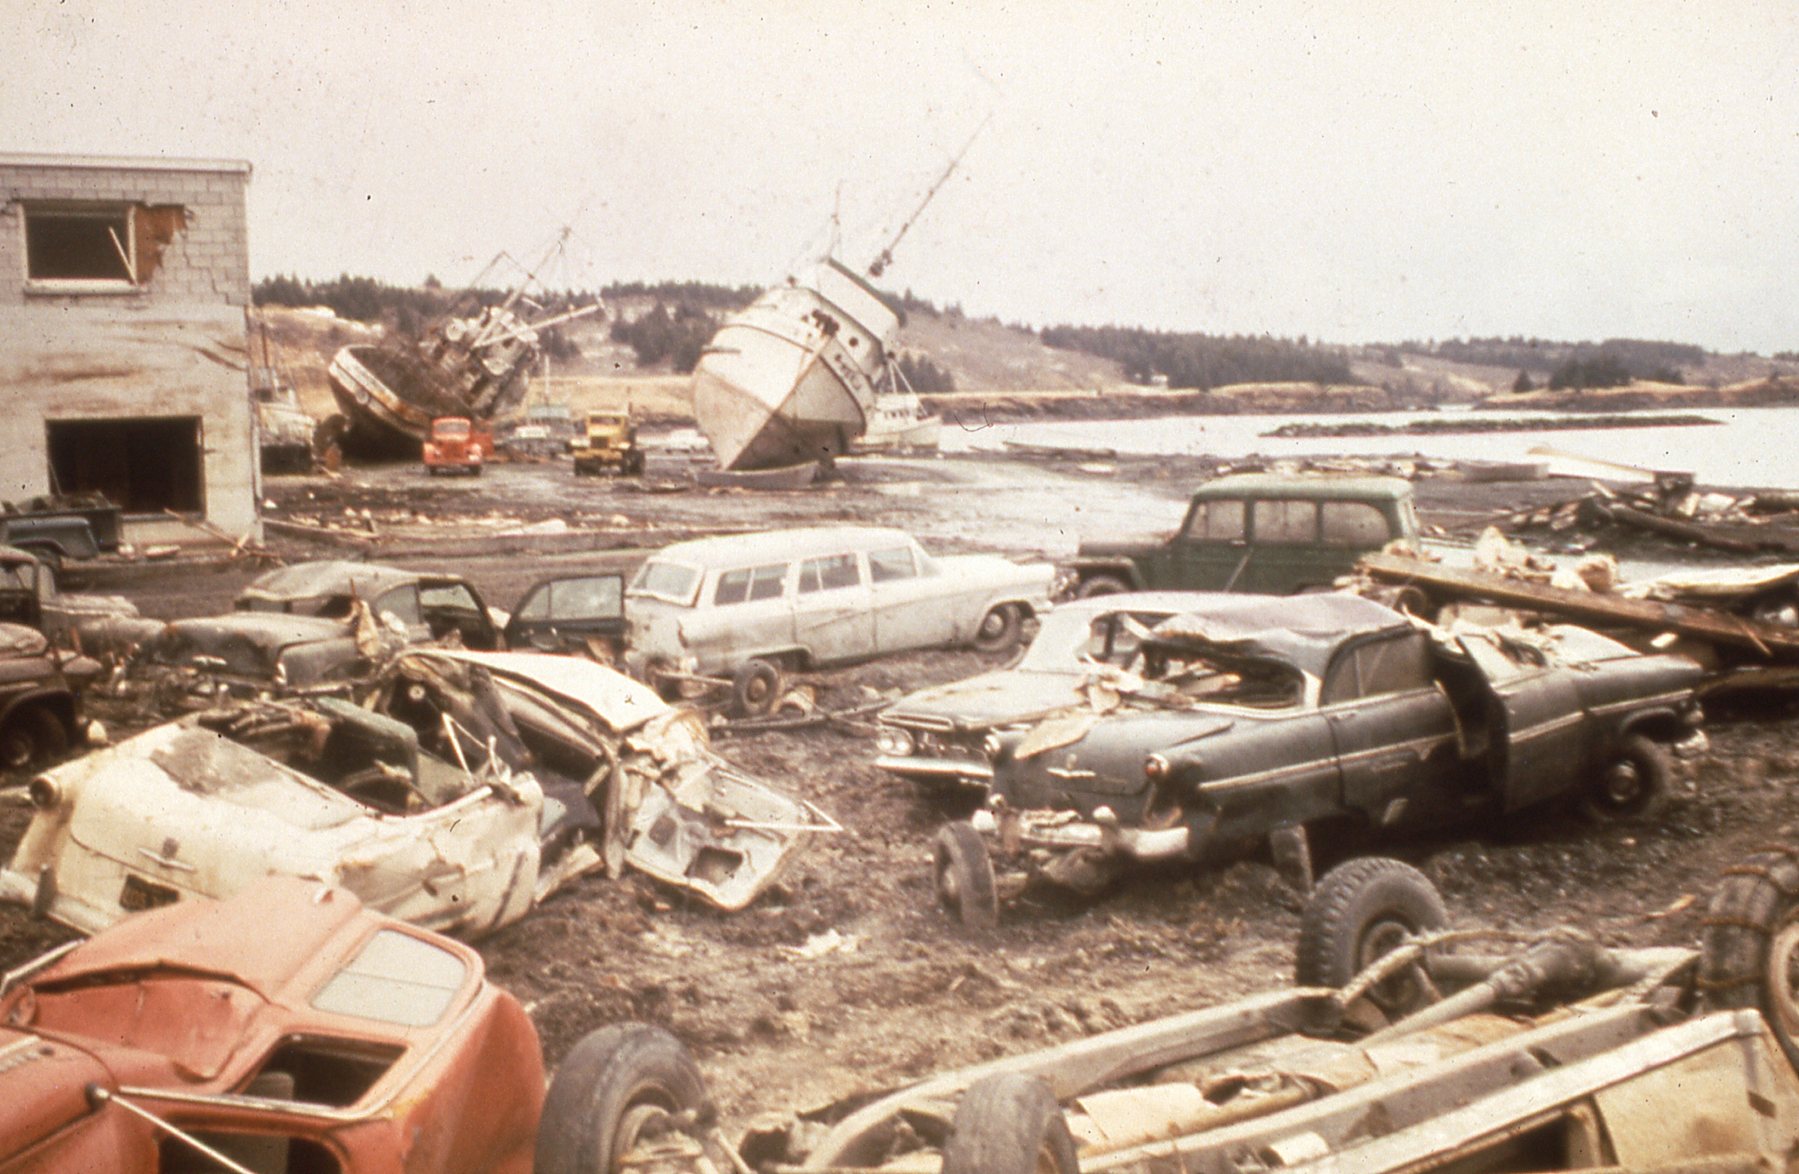
Figure 2 / Alaska, 1964

What reached the waterfront.

Historic color photograph of wrecked cars, boats, and debris along the Kodiak, Alaska waterfront after the 1964 tsunami.
Figure 2. Tsunami damage in Kodiak, Alaska, after the 1964 earthquake. Credit: USGS Alaska Technical Data Unit, catalogue SF-GP-00-0107. Public domain. USGS photograph record Open full-size image ↗

Figure 3 / Japan, 2011

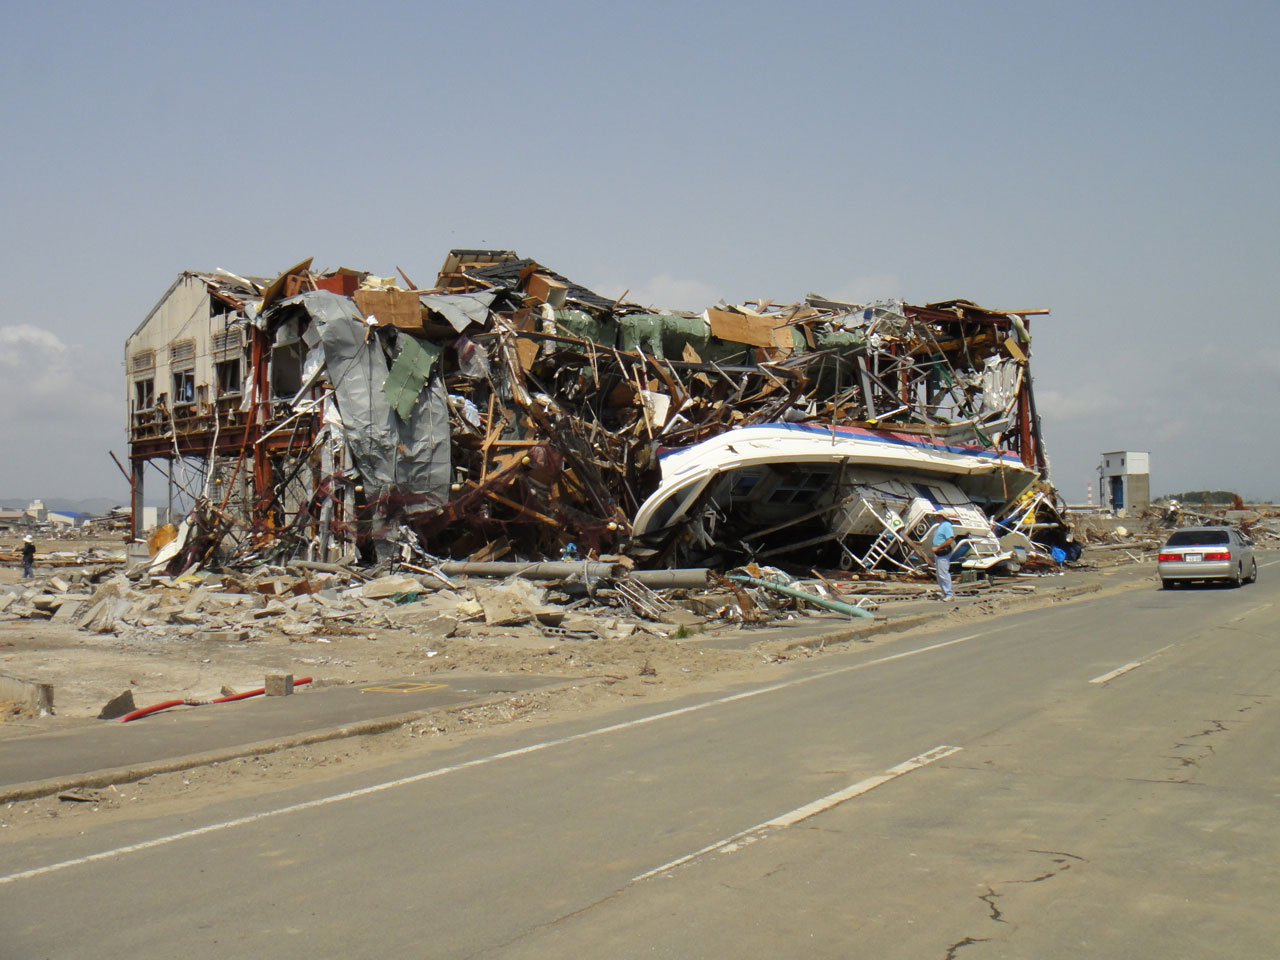
The damage remains after the water recedes.

Photograph of a damaged building, an overturned boat, and debris in Natori, Japan, with a person and vehicle providing a sense of scale.
Figure 3. Wreckage in Natori, Japan, photographed after the March 2011 earthquake and tsunami. Credit: Bruce Jaffe, USGS. Public domain. USGS photograph record Open full-size image ↗

Figure 4 / Japan, 2011 / Across the Pacific

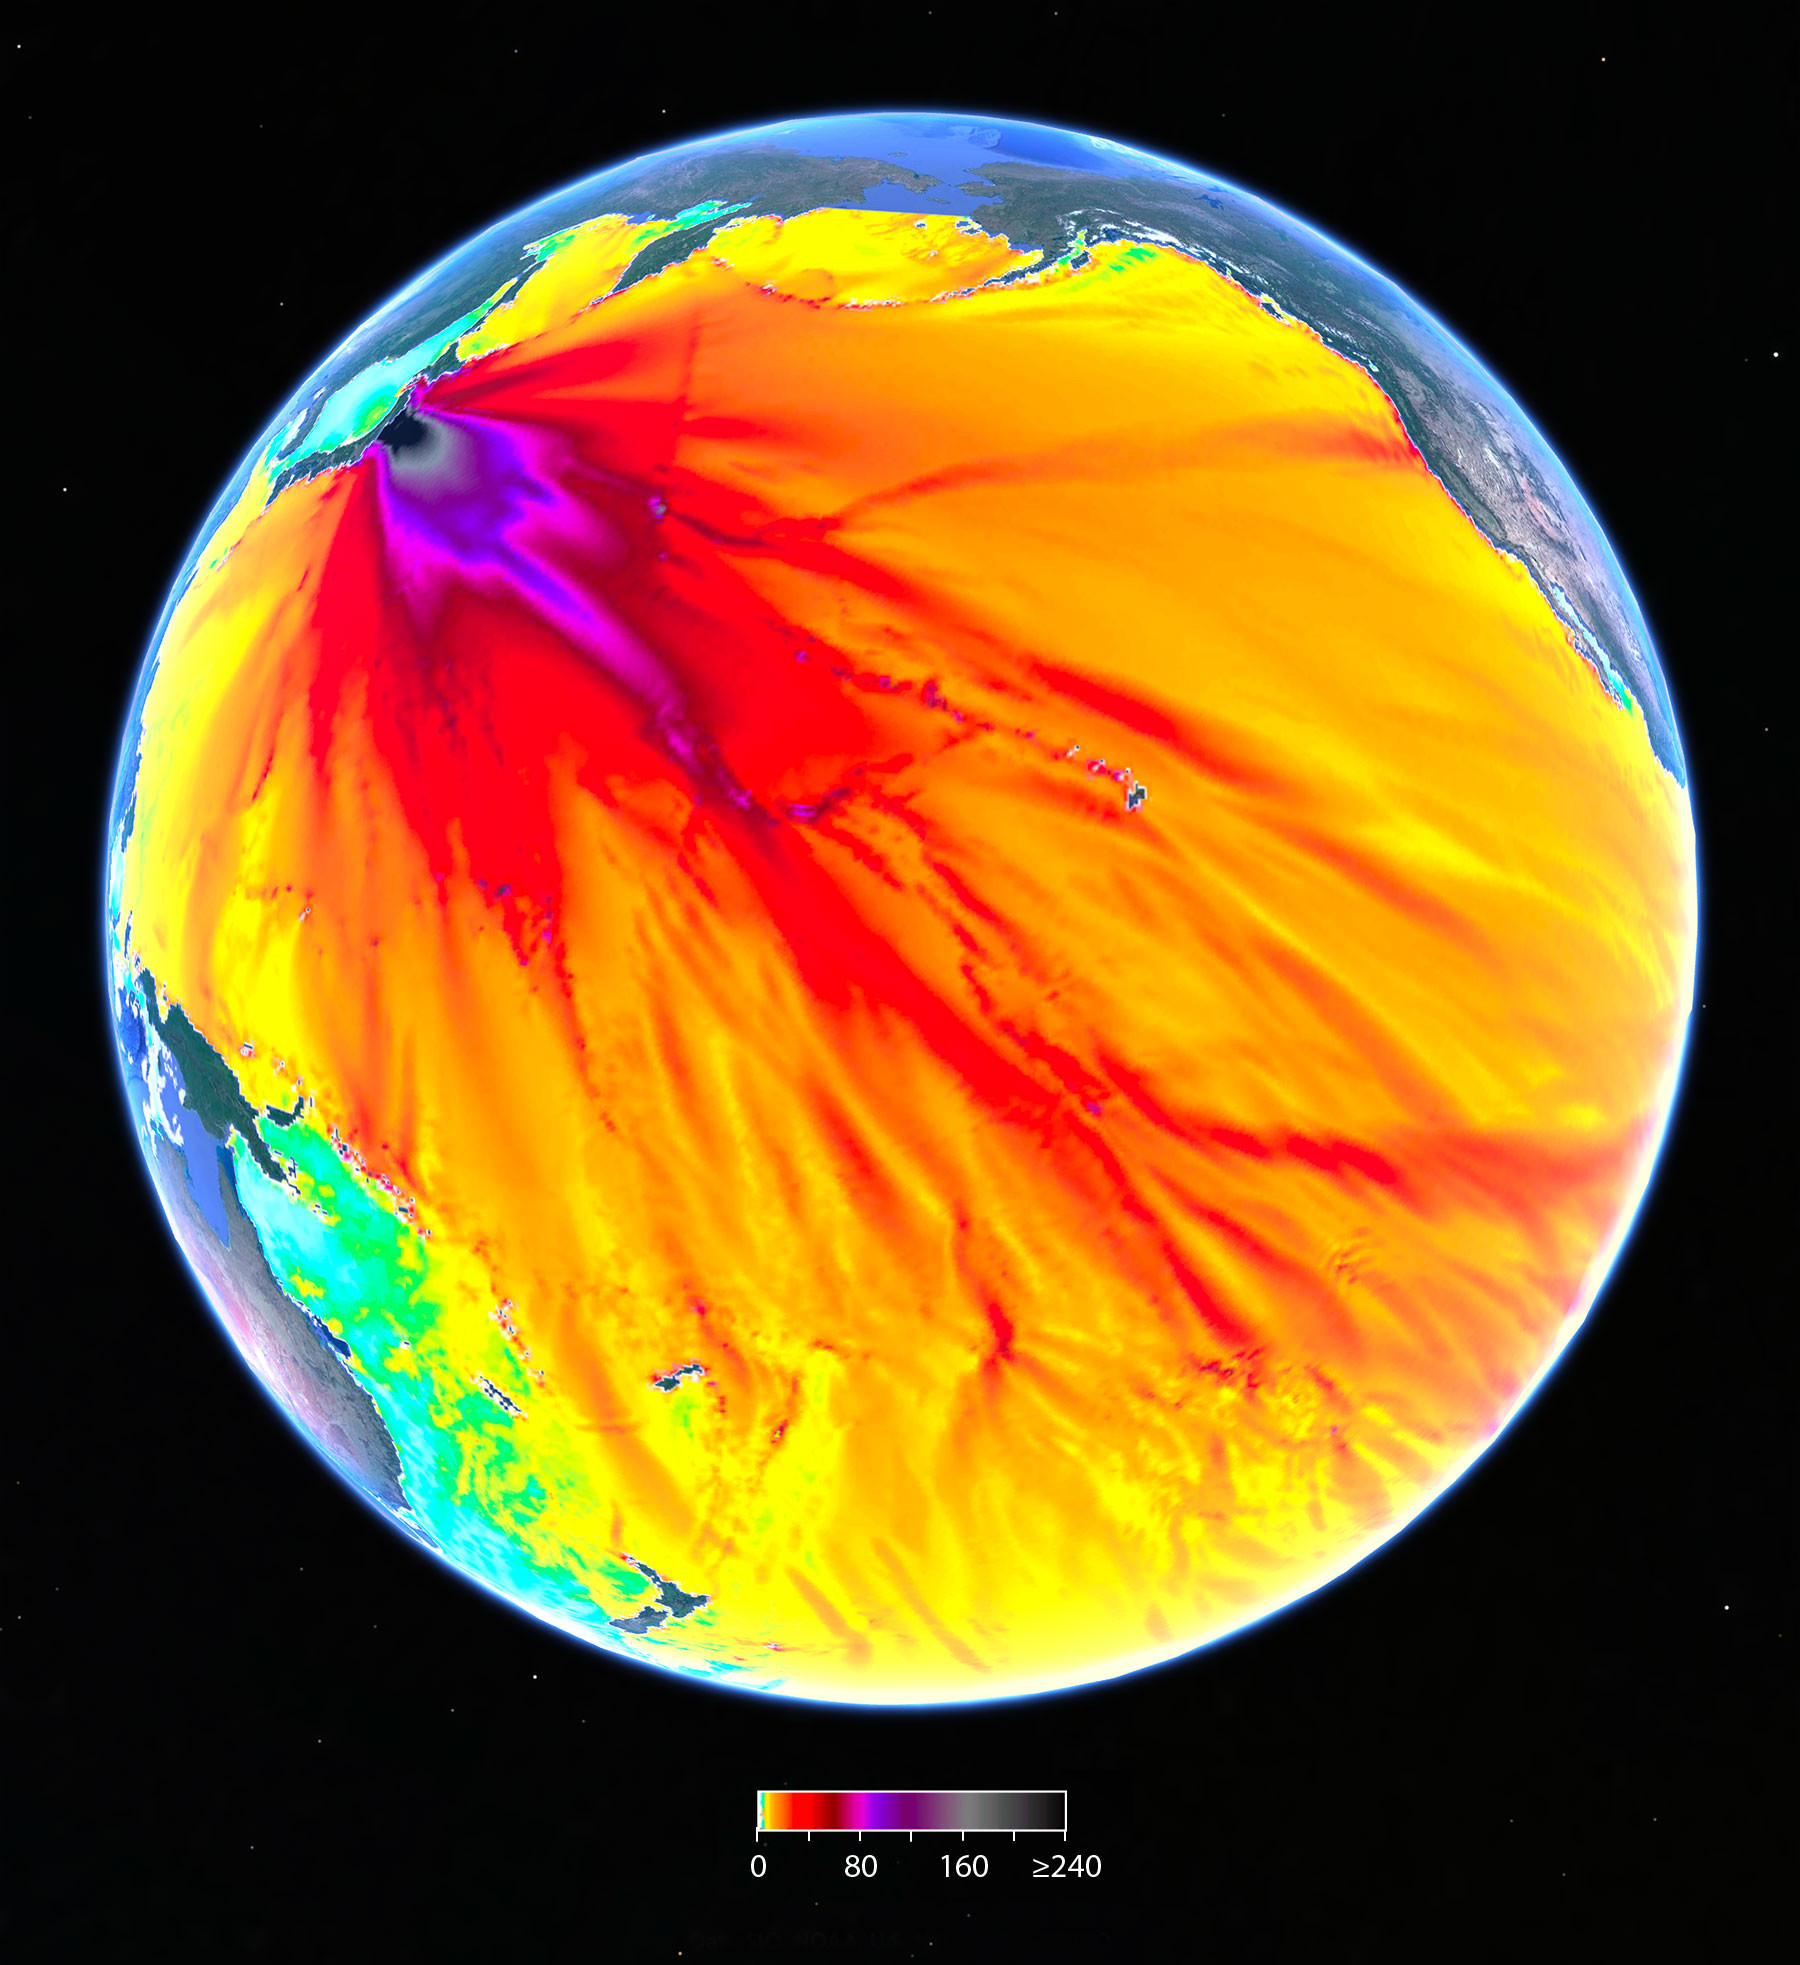
An earthquake on one coast can matter on another.

NOAA PMEL model of the March 2011 Japan tsunami across the Pacific, with Japan on the left and North America on the right. The color scale runs from 0 to at least 240 centimeters of maximum deep-water wave amplitude.
Figure 4. Colors show modeled maximum tsunami amplitudes in deep water for the March 2011 Japan event. The scale is in centimeters. Coastal flooding requires a local assessment; this is a historical model visualization.

Look closer. Locate Japan, Hawaii, and the U.S. West Coast. Why would a warning network need measurements from across this ocean?

Credit: NOAA/PMEL, reproduced from Bernard, Meinig, Titov, and Wei (2023), Oceanography, opening illustration. Source article · CC BY 4.0. Image reproduced unchanged.Open full-size image ↗

Historical estimates can differ between sources. Each death estimate is attributed to the linked NOAA record, with earthquake and tsunami totals distinguished.

02 / How warnings work

From a moving seafloor to a community taking action.

Many earthquake-generated tsunamis begin when sudden seafloor movement displaces water. Not every earthquake generates a tsunami. How tsunamis form ↗

Figure 5 / How warnings reach people

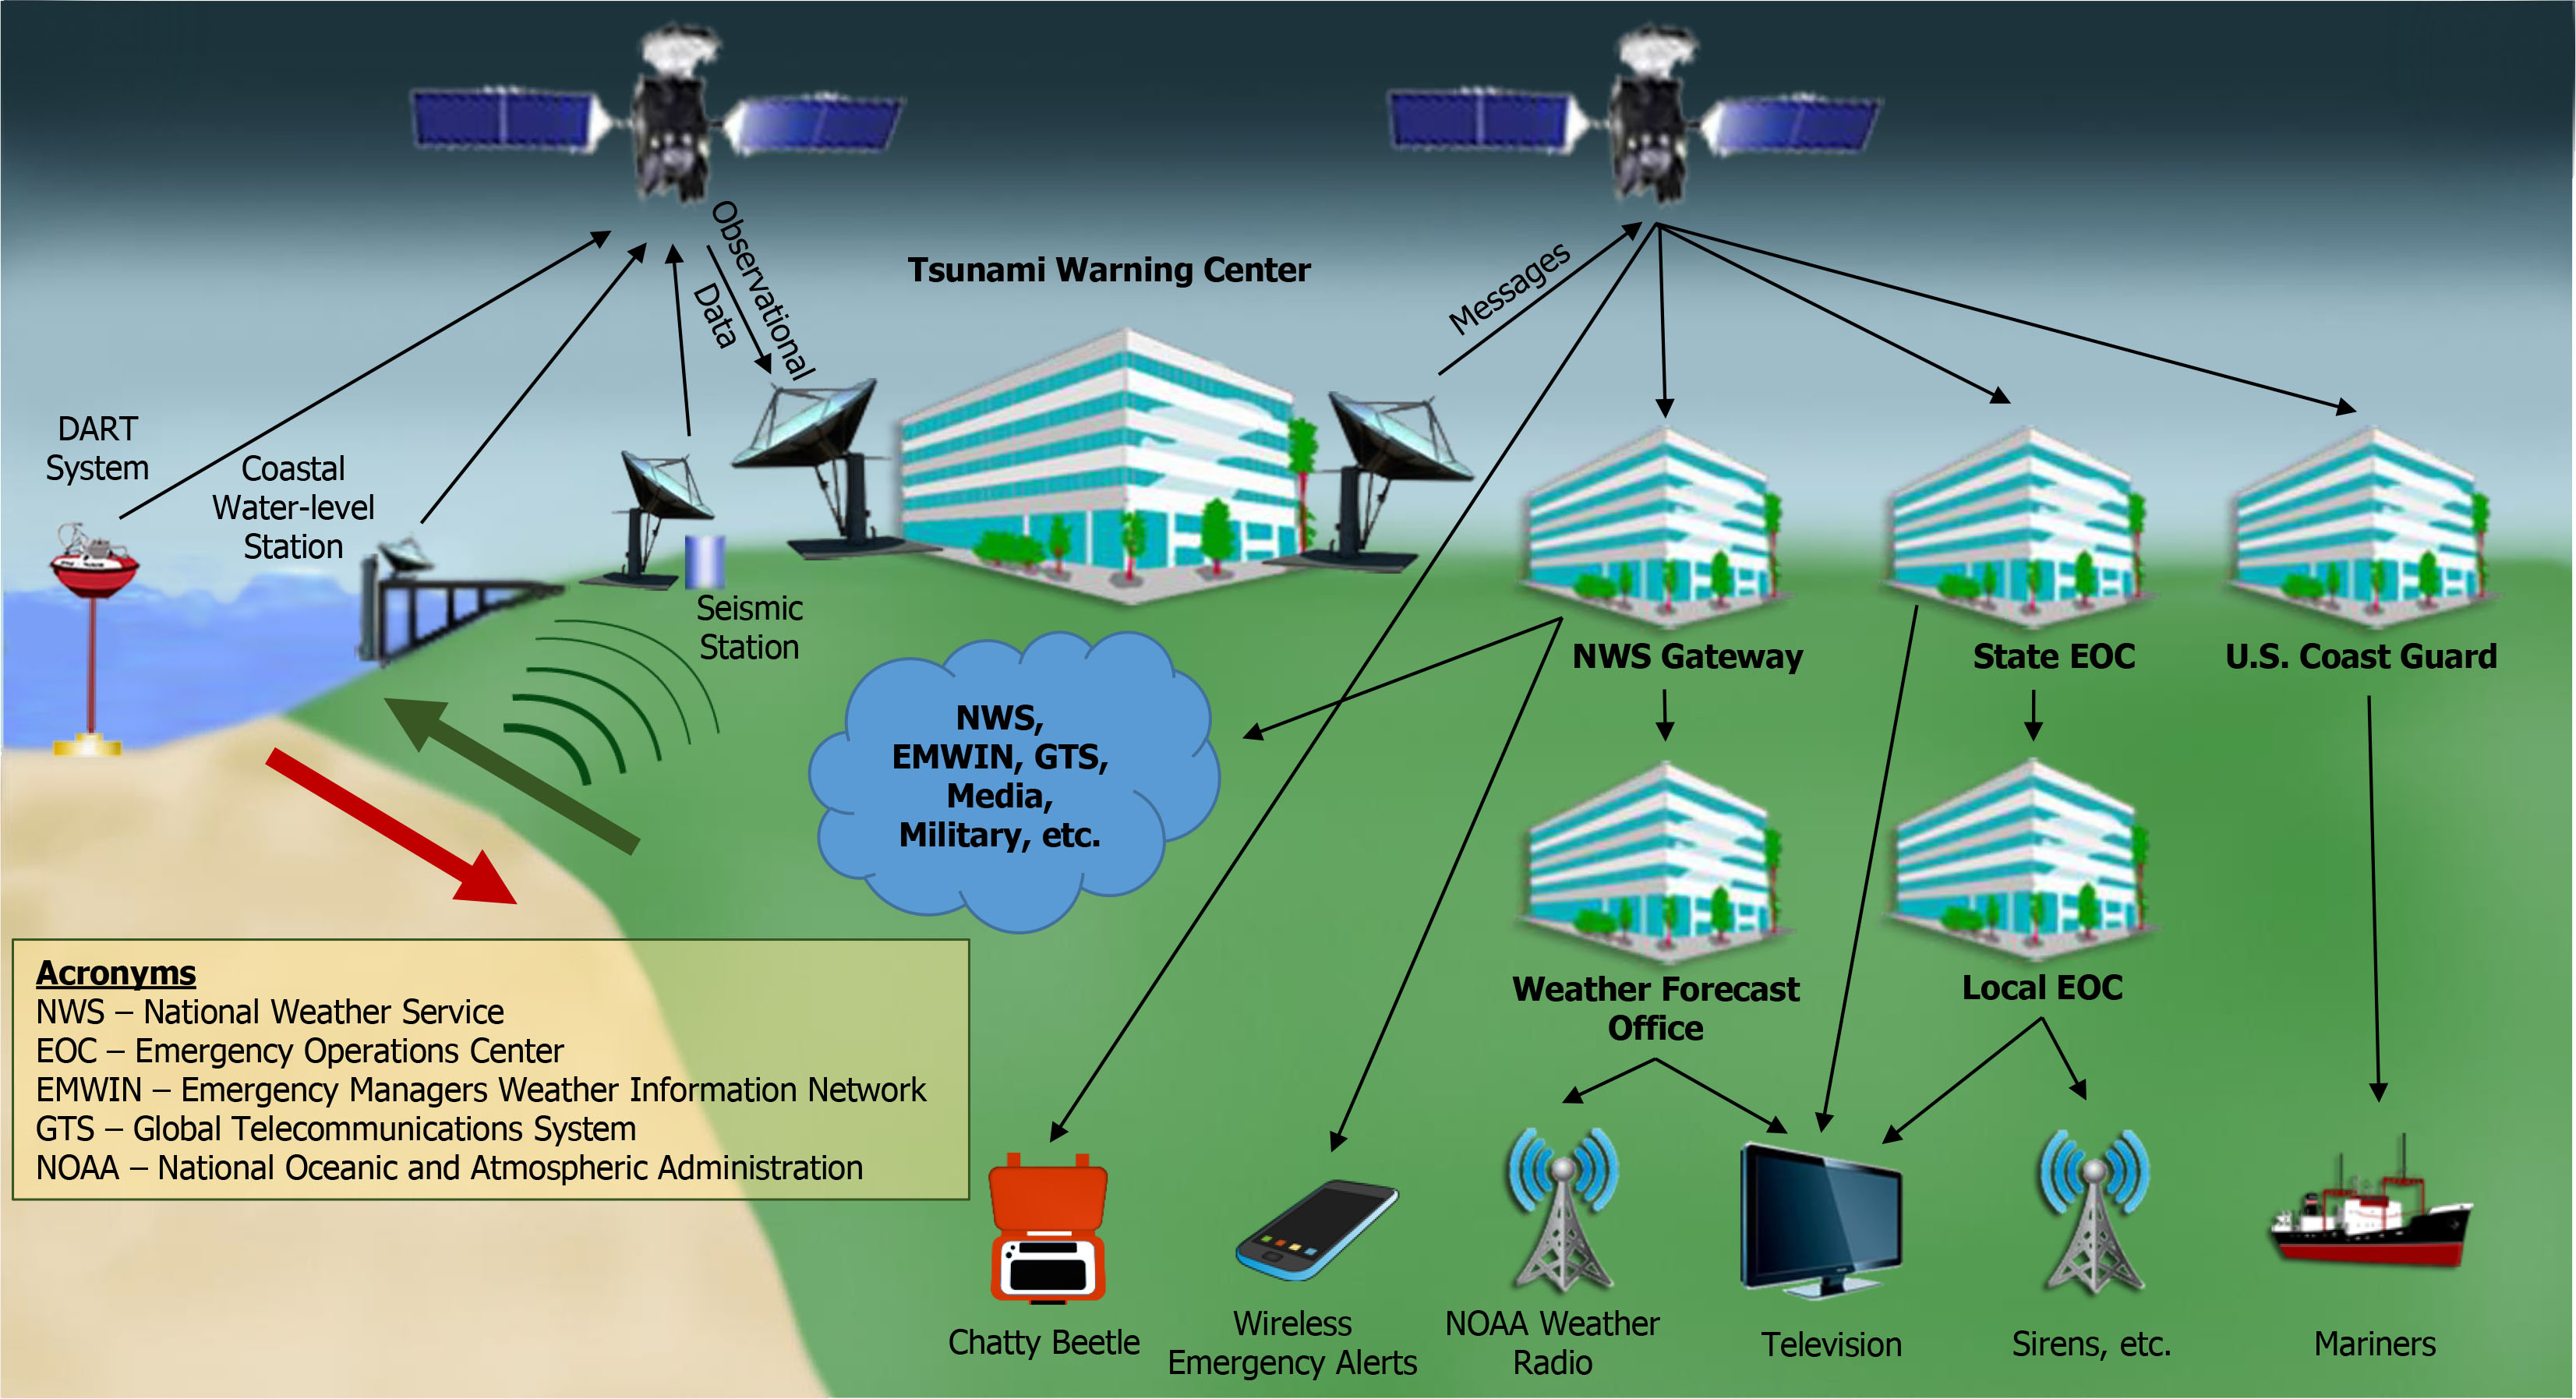
The instruments are only the beginning.

NOAA diagram connecting seismic stations, a DART buoy, and a coastal sea-level station to a tsunami warning center, then to emergency managers, broadcasters, and the public.
Figure 5. Follow the observations into the warning center, then follow the messages out to the coast. Sensors, communications, forecasters, and local response all have a role. Credit: NOAA/National Weather Service, National Tsunami Hazard Mitigation Program. NOAA/NWS source Open full-size image ↗

Figure 6 / Inside a DART station

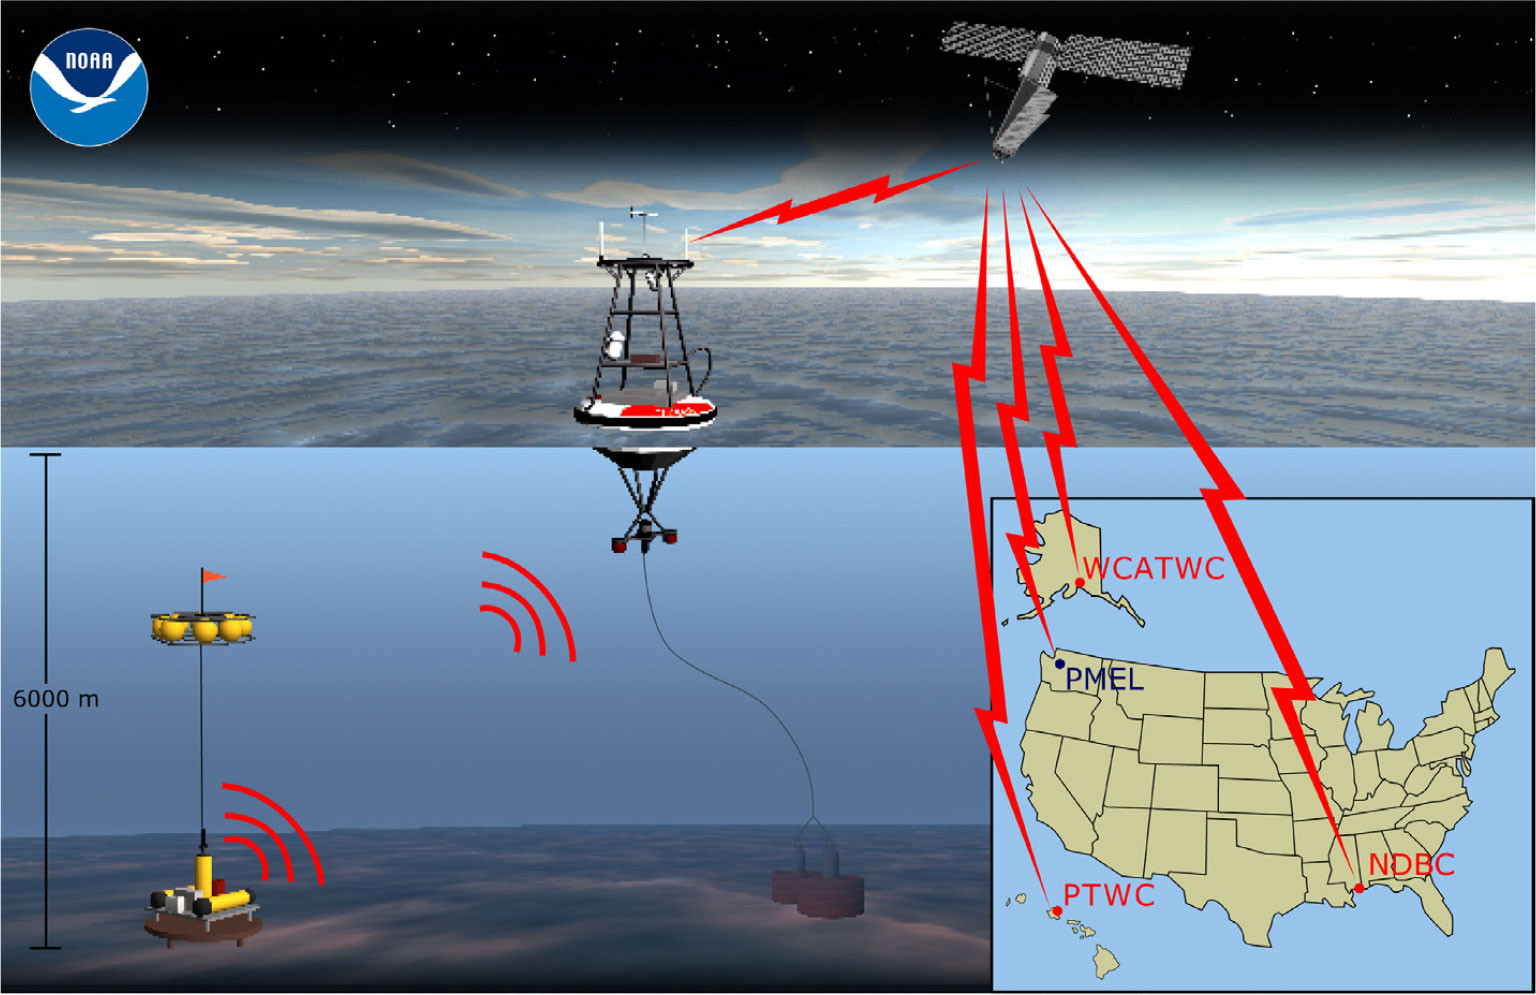
The measurement starts on the seafloor.

NOAA DART cutaway showing a bottom pressure recorder communicating acoustically with a surface buoy, and the buoy transmitting by satellite to shore facilities. The original diagram includes historical warning-center labels.
Figure 6. The seafloor pressure recorder sends measurements through an acoustic link to the buoy, which relays them by satellite to shore. The original diagram retains historical warning-center labels.

Look closer. Trace the measurement from the pressure recorder to shore. Which links need power, maintenance, and reliable communications?

Credit: NOAA/PMEL, reproduced from Bernard, Meinig, Titov, and Wei (2023), Oceanography, Figure 2. Source article · CC BY 4.0. Image reproduced unchanged.Open full-size image ↗

Figure 7 / The equipment at sea

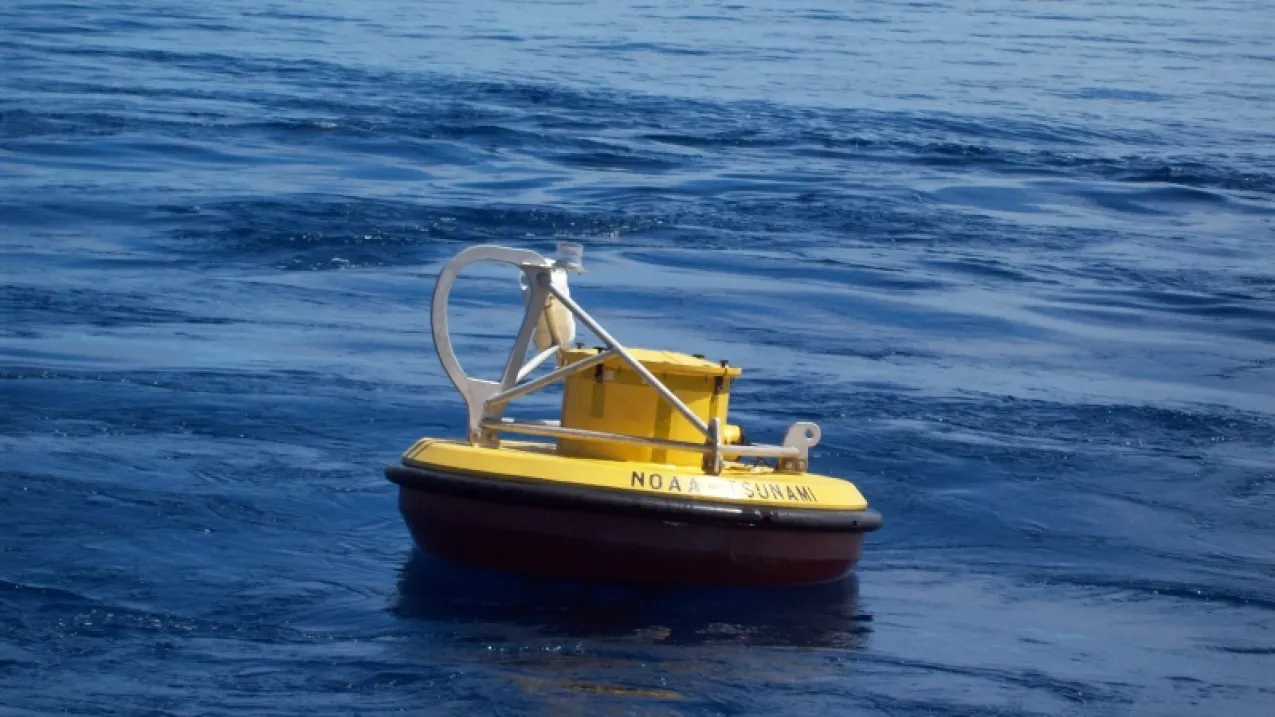
A NOAA DART surface buoy.

NOAA’s yellow and black tsunami-monitoring buoy floating in the ocean.
Figure 7. The visible part of a DART system. A separate recorder on the seafloor measures pressure changes; the buoy relays data. Photograph: NOAA, reproduced from the saved 2024 modernization announcement, page 2. Open full-size image ↗

These jobs overlap. NOAA may issue an initial alert while ocean measurements are still arriving.

The U.S. has exposed coastlines.

Alaska, Hawaii, the West Coast, and Pacific and Caribbean territories face substantial tsunami hazards. Low-lying communities and harbors can be threatened by local events or waves crossing an ocean. NOAA/NWS coastal hazards ↗

A nearby tsunami can outrun an official alert.

In a coastal hazard zone, strong or long shaking, unusual sea movement, or an ocean roar can be a natural warning. Protect yourself during shaking; when you can move safely, follow evacuation routes to high ground or inland. Do not wait for an official alert. NOAA/NWS safety guidance ↗

03 / What readiness costs

The public pays for readiness on quiet days, too.

Both NOAA and USGS maintain sensor networks with partners at substantial taxpayer expense. Public funding keeps instruments reporting, communications working, and specialists ready to interpret an event.

NOAA’s DART instruments are designed for tsunami detection. USGS seismic networks also support earthquake response, shaking alerts, engineering, and hazard research. USGS network mission ↗

A warning depends on this work being done before the earthquake happens.

USGS / annual monitoring appropriation

$62.6 million

Congress appropriated $62.645 million for FY2024 ANSS earthquake and crustal-deformation monitoring and reporting. This supports broader earthquake functions, so it is not a tsunami-only budget.

See the wider USGS program budget
FY2024 Earthquake Hazards Program
Appropriated funding, millions of dollars
PurposeAmount
Hazard and risk assessment$16.376
Research on causes and effects$13.630
ANSS monitoring and reporting$62.645
Program total$92.651

Monitoring accounts for about two-thirds of this program. Research and hazard assessment help turn observations into risk reduction.

NOAA / modernization investment

$30 million

Announced in May 2024 to modernize DART equipment described as 20 years old, improving data availability and reliability. NOAA awarded a development contract to SAIC using infrastructure-law funding.

The announcement scheduled replacement for 2025–2028. It does not establish current progress or an annual operating total.

These are dated examples with different scopes: one annual USGS allocation and one NOAA upgrade project. Adding them would not give the system’s annual cost.

Budget chart / Reading the public investment

One USGS program. Three kinds of work.

FY2024 Earthquake Hazards Program appropriations: $92.651 millionMonitoring and reporting: $62.645 million, about 67.6 percent. Hazard and risk assessment: $16.376 million, about 17.7 percent. Research: $13.630 million, about 14.7 percent.
  • $62.645 millionANSS monitoring and reporting
    67.6% of the program
  • $16.376 millionHazard and risk assessment
    17.7% of the program
  • $13.630 millionTargeted earthquake research
    14.7% of the program
FY2024 appropriation. This chart uses USGS budget data. The full bar represents $92.651 million appropriated for the FY2024 Earthquake Hazards Program. It includes broader earthquake work and is separate from NOAA’s modernization project. Source: USGS table 1, printed page 8.

Three kinds of observations. Different jobs.

Ground / USGS and partners

≈150 global seismic stations

The Global Seismographic Network is a USGS, National Science Foundation, and EarthScope partnership. Stations record ground motion and send data for rapid earthquake analysis. U.S. regional networks add further coverage; this count is for the GSN alone.

Where was the earthquake, and how large was it?

Explore the USGS network ↗

Deep ocean / NOAA

39 NOAA DART systems

Each system pairs a pressure recorder on the seafloor with a moored surface buoy. It detects changes in the water column as a tsunami passes. NOAA’s National Data Buoy Center operates and maintains this U.S. network; other countries also contribute observations.

What is the wave doing in the open ocean?

NOAA’s ocean instruments ↗

Coast / NOAA tide gauges

1 minute between tsunami-capable gauge reports

Coastal water-level measurements help warning centers track arriving waves and refine forecasts. This network also serves navigation, coastal planning, and flood response.

What is actually happening at the shore?

How NOAA uses tide gauges ↗ · Open the station map ↗

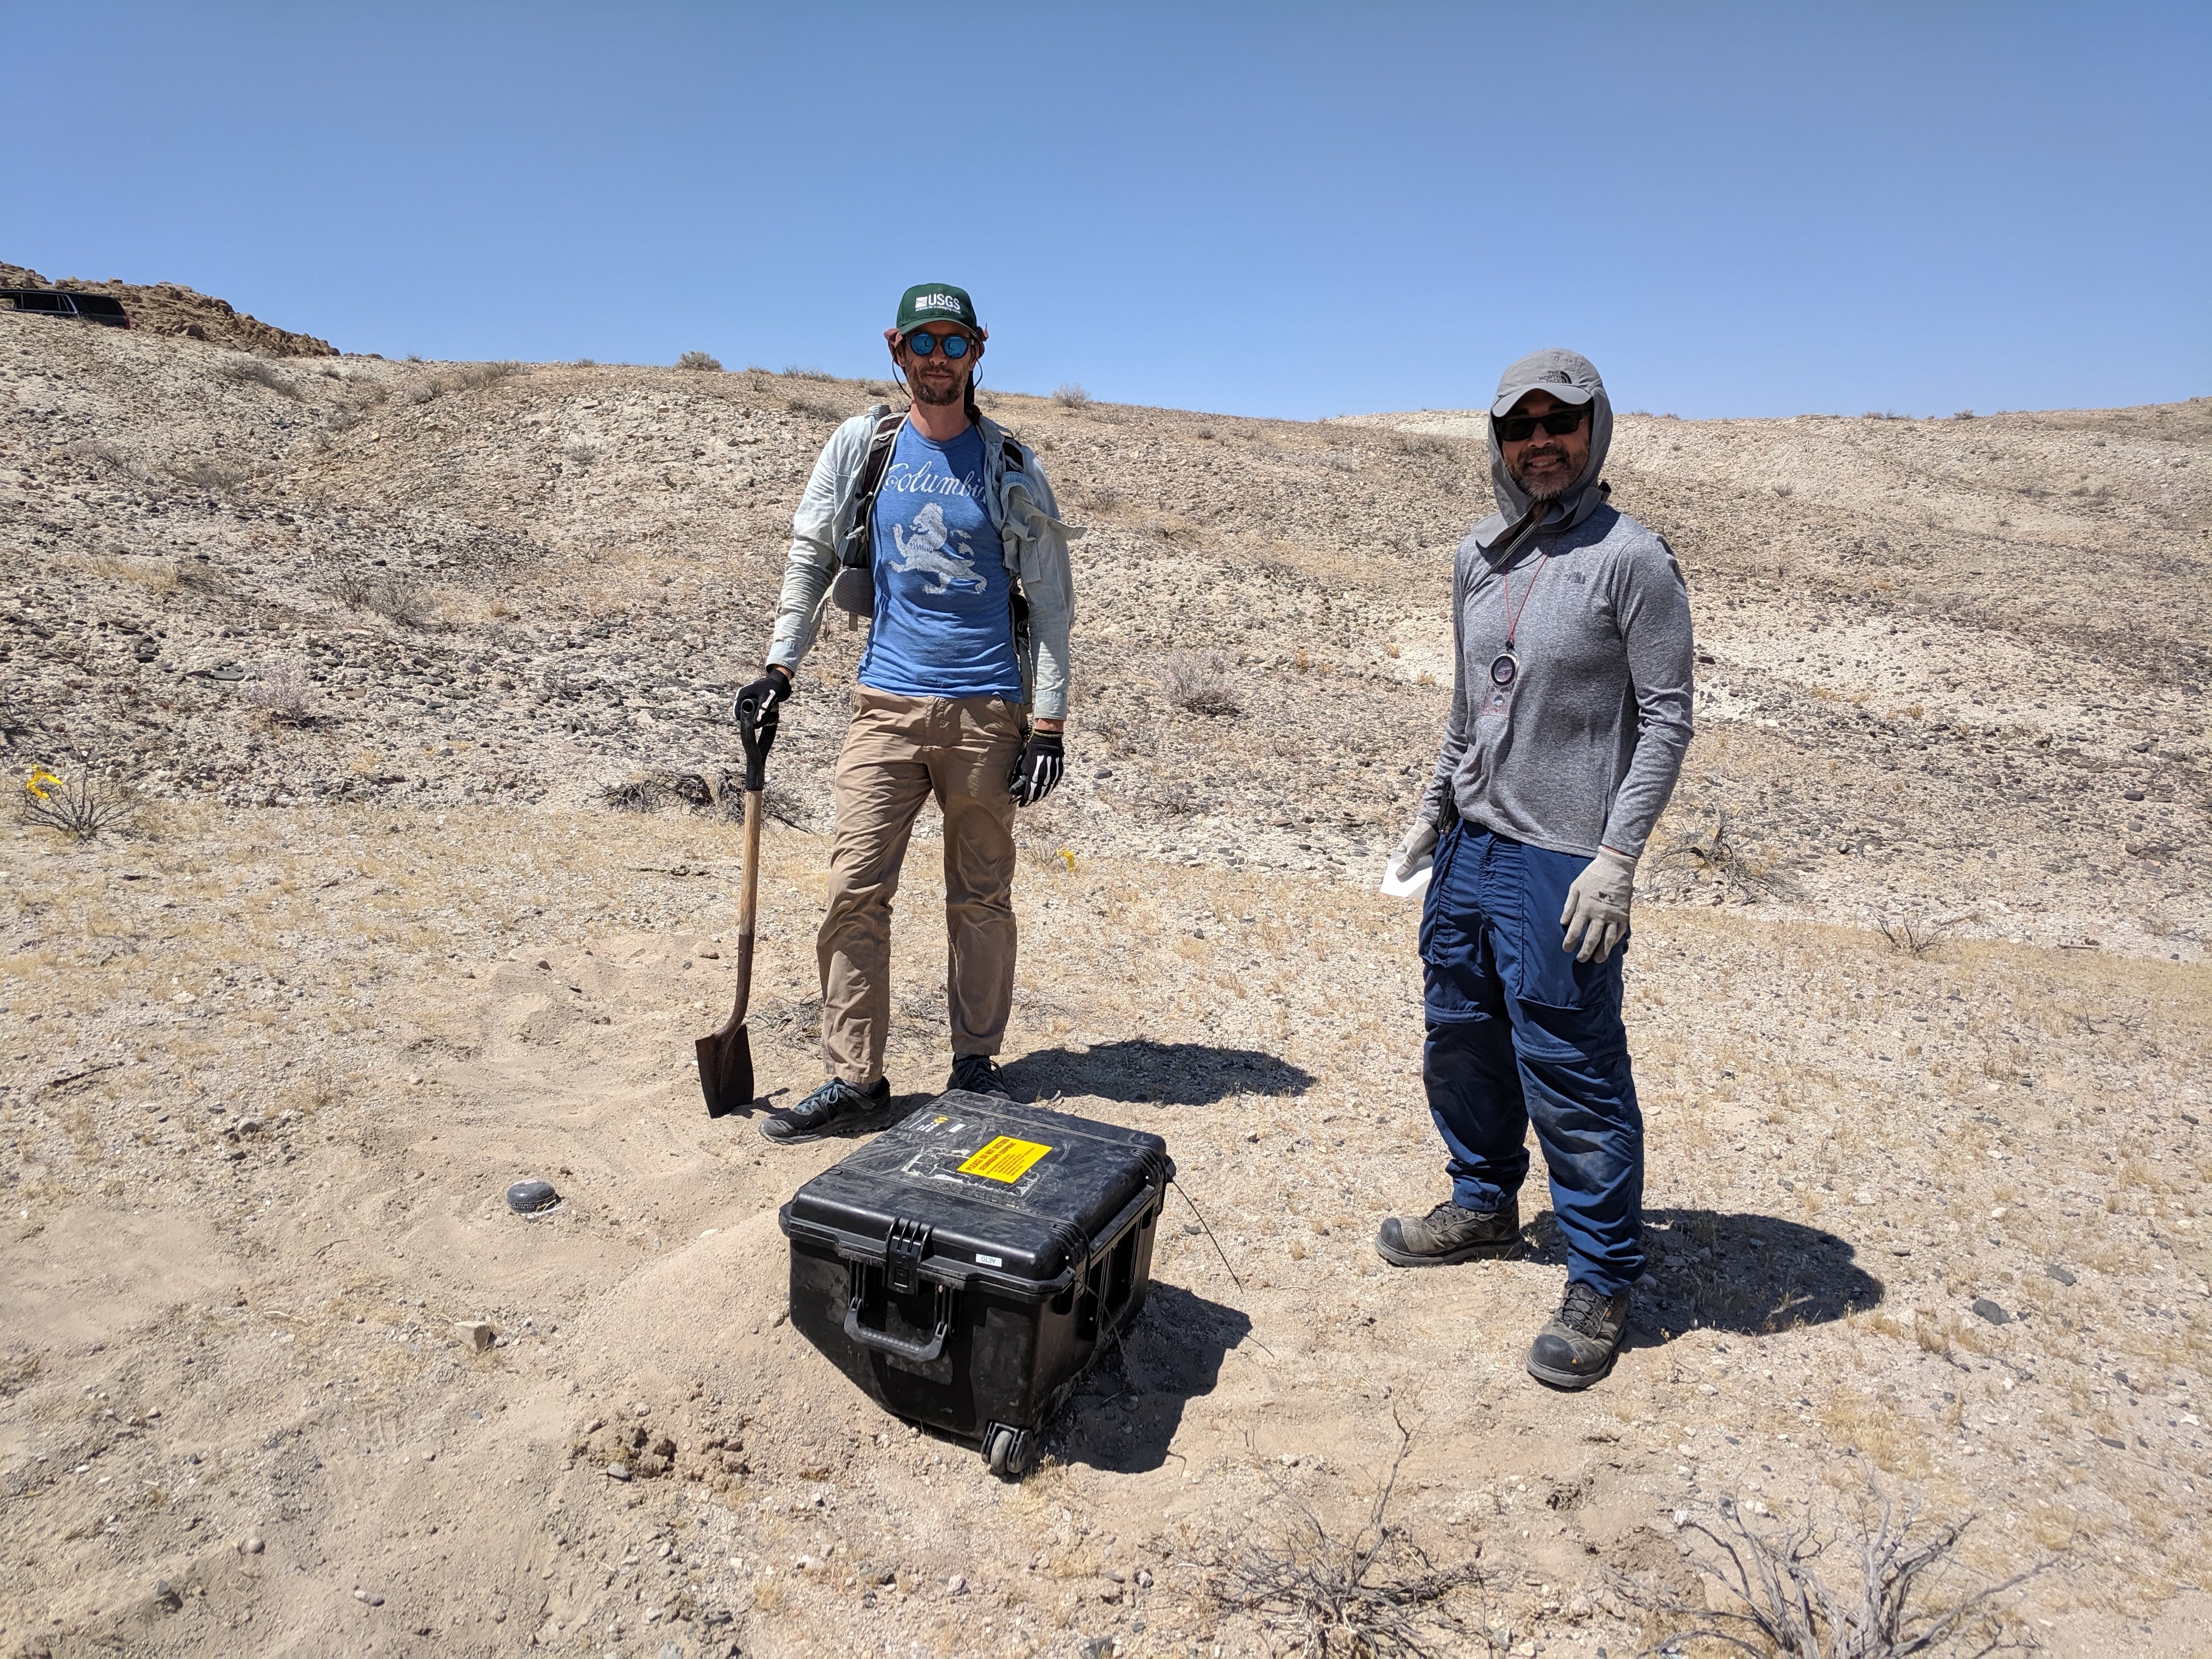
Figure 8 / The people behind the measurements

Someone has to put the instruments in the ground.

Two USGS field workers beside a seismometer installation and equipment case in the desert near Ridgecrest, California; one holds a shovel.
Figure 8. Installing a seismometer near Ridgecrest, California, in 2019. This is earthquake-monitoring fieldwork; seismic networks serve broader earthquake needs as well as informing tsunami assessment. Credit: Elizabeth Cochran, USGS. Public domain. USGS photograph record Open full-size image ↗
What needs funding between disasters?

Equipment and field work

Seismic stations need sensor upgrades, calibration, and continuing maintenance, including at remote sites. That work keeps their measurements useful to USGS and NOAA.

USGS laboratory priorities, 2026 ↗

Ocean servicing and power

DART equipment must be deployed and recovered at sea. Battery packs power the underwater recorder and buoy; moorings hold the buoy in position. Batteries, electronics, and communications require monitoring. The DART II design includes duplicate buoy electronics for backup.

NOAA engineering and recovery details (PDF) ↗

People and forecasting

NOAA’s warning centers monitor 24 hours a day, every day. Specialists need maintained computing systems and forecast models to turn incoming measurements into useful warnings.

NOAA’s continuous watch ↗ · Forecasting work ↗

What the historical evidence implies

In a severe event threatening populated U.S. coasts, timely warnings and effective evacuation could save many thousands of lives. The actual benefit depends on warning time, exposure, and people’s ability to act. NOAA credits the connected warning and evacuation system with limiting deaths outside Japan in 2011. NOAA’s assessment ↗

Discuss: what should we measure besides the number of disasters in a single year when judging this public investment?

Check your understanding

Connect the evidence to the system.

04 / Discuss what you learned in BoodleBox

Make the case for being ready.

Use one historical example to explain your thinking. Answer the questions below, then copy your response into BoodleBox to discuss it with your bot.

The event’s facts and source links will accompany your answers.

Optional investigation: examine today’s USGS earthquake feedWhat can seismic data tell us—and what still requires ocean observations and NOAA’s assessment?

Recent earthquake reports · This is not a tsunami warning map. Open official alerts ↗

Open the explorer to load the current feed.

Earthquakes—
Largest magnitude—
Median depth—

Select an event to inspect it

<70 km 70–300 km >300 km

Recent events

MagnitudeLocation / UTC timeDepthAction

No events loaded yet.

This optional note contains the feed and reference-section answers. Your guided investigation has its own checkpoints above.

Start fresh?

Choose what to clear. Both options return to the first stop.

Bring it back to the conversation

Your evidence note

Review the note. In a paired Chrome chat, choose Put note in BoodleBox. Otherwise choose Copy note for BoodleBox and paste it into the chat. You press Send either way.

If BoodleBox treats the note as an attachment, type Discuss this checkpoint and send. Copying does not send anything.